Main content starts here

Co-Enzyme B Complex - Pharmacokinetics (pk) Study

Bioavailability study

B-vitamins are essential nutrients required for energy production, synthesis of blood cells, healthy nervous system function, and other metabolic processes.* Coenzyme B vitamins are the active, coenzyme forms of B vitamins that are utilized by the body in most metabolic reactions.* Three healthy adult volunteers 22 to 55 years old participated in a clinical trial to study the bioavailability of Co-Enzyme B-Complex, a dietary supplement from NOW® (item # 0405). Plasma vitamin B2, B3, B5, B6, folate, and B12 were measured at baseline, and 1, 2, 3 and 6 hours following oral administration of two tablets of Co-Enzyme B-Complex.
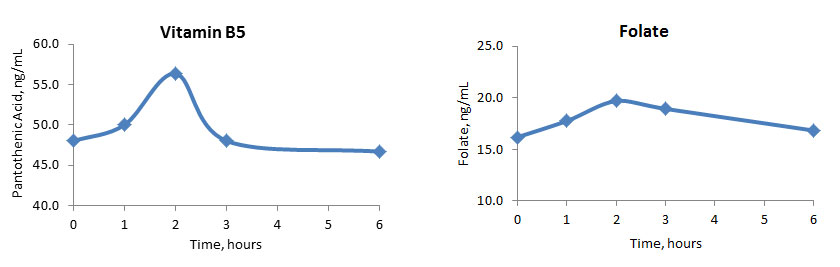
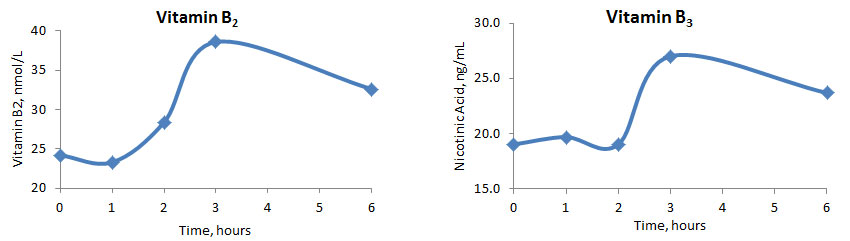
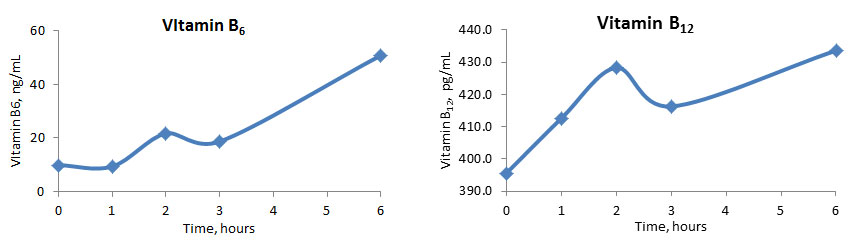
Results

The average plasma vitamin B5 and folate peaked two hours after supplementation, reaching the levels of 17% and 22% over the baseline, respectively. Average plasma vitamin B2 and B3 peaked at three hours reaching the levels of 60% and 42% over the baseline, respectively. Average plasma vitamin B6 and B12 increased gradually over the period of the study, reaching maximum concentration at six hours, 417% and 10% over the baseline, respectively. The study confirms the bioavailability NOW® Co-Enzyme B-Complex.


Two graphs. left graph labeled “Vitamin B5” has Y axis labeled “PantothenicAcid, ng/ml” and X axis labeled “Time, hours”. The line on the graph shows starting at hour 0 around 48.0 PantothenicAcid, ng/ml. The line moves up to 56.0 on the PantothenicAcid, ng/ml at hour 2 then moves down to 46.0 PantothenicAcid, ng/ml at hour 3 and levels off there until hour 6. Left Graph labeled “Folate” has Y axis label of Folate, ng/mL and a X axis labeled Time, hours. The line on this graph starts at hour 0 at 16.0 Folate, ng/mL grading moving up to 17.0 at hour 1, 20.0 hour 2, then down to 18.0 hour 3 and end at 16.0 again at hour 6.


Two graphs. Left graph labeled “Vitamin B2” has Y axis labeled “Vitamin B2, nmol/L” and X axis labeled “Time, hours”. The line on the graph shows starting at hour 0 around 24 Vitamin B2, nmol/L. The line dips down to 23 Vitamin B2, nmol/L at hour 1. Then moves up to 28 Vitamin B2, nmol/L hour 2. Jumps to 38 Vitamin B2, nmol/L at hour 3. Moves down to end around 33 Vitamin B2, nmol/L at hour 6.  Right Graph labeled “Vitamin B3” has Y axis label of NicotinicAcid, ng/mL and a X axis labeled Time, hours. The line on this graph starts at hour 0 at 19.0 NicotinicAcid, ng/mL grading moving up to 20.0 NicotinicAcid, ng/mL at hour 2, then jumps to 28.0 NicotinicAcid, ng/mL at hour 3. Then dips down to 24.0 NicotinicAcid, ng/mL by hour 6.


Two graphs. left graph labeled “Vitamin B6” has Y axis labeled “Vitamin B6, ng/mL” and X axis labeled “Time, hours”. The line on the graph shows starting at hour 0 around 10 Vitamin B6, ng/mL. The line moves up to 20 on the Vitamin B6, ng/mL at hour 2 then moves down to 19 Vitamin B6, ng/mL at hour 3 then continues to rise to level 50 at hour 6. Left Graph labeled “Vitamin B12” has Y axis label of Vitamin B12, pg/mL and a X axis labeled Time, hours. The line on this graph starts at hour 0 at 395.0 Vitamin B12, pg/mL grading moving up to 430.0 Vitamin B12, pg/mL at hour 2, then down to 415.0 at hour 3. Then back up to 435.0 Vitamin B12, pg/mL by hour 6.

*These statements have not been evaluated by the Food and Drug Administration. These products are not intended to diagnose, treat, cure or prevent any disease.